
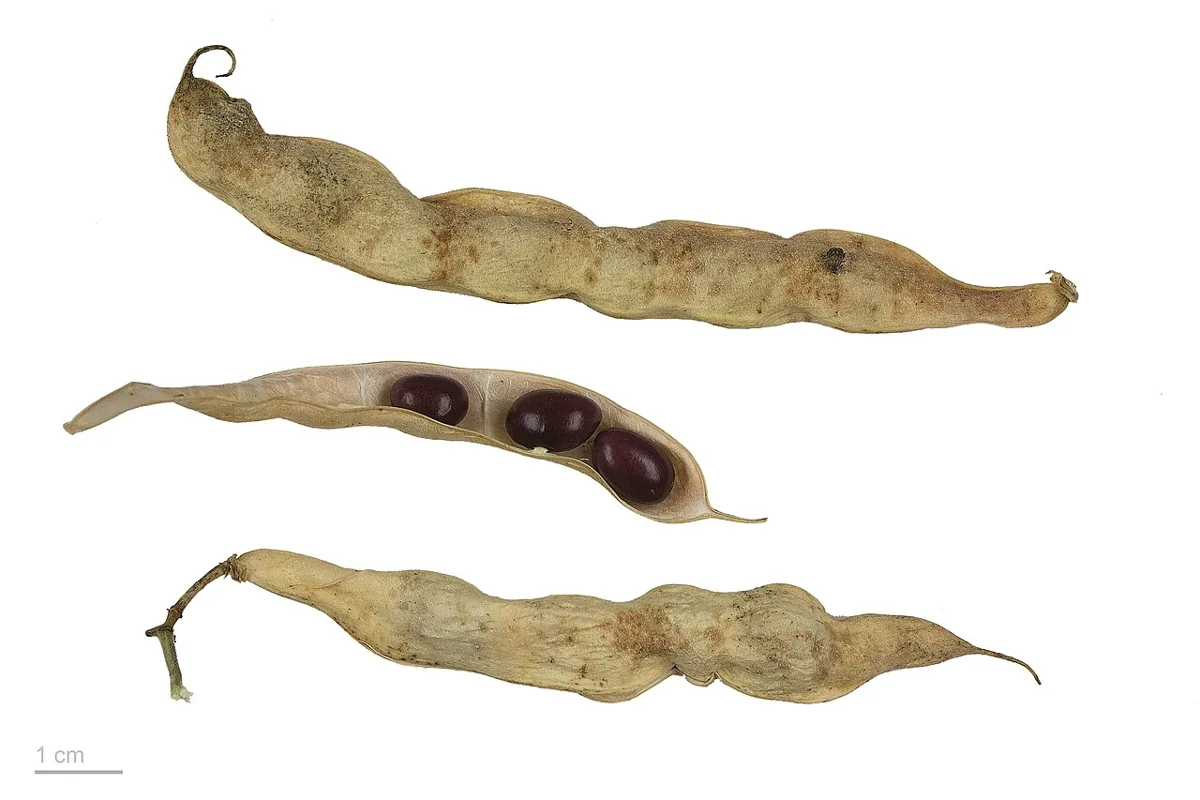
 June–September in Turkey (approximate harvest period)
Cranberry Beans Nutrition Facts, Vitamins and Benefits
Cranberry Beans (Phaseolus vulgaris) is included in the Topraktan Bilgiler vegetable library. Per 100 g it provides approximately 335 kcal and includes 604 µg folate, 24.7 g fiber, 1,332 mg potassium. Values can vary with variety, ripeness, growing conditions and preparation.
Cranberry Beans benefits and place in a balanced diet
- A 100 g portion provides approximately 335 kcal; portion size and preparation affect total energy intake.
- Its approximately 12.6 g of water per 100 g contributes to total fluid intake.
- Its approximately 24.7 g of dietary fiber per 100 g contributes to fiber intake; a fiber-containing diet can support normal bowel function and fullness.
- About 5.6 µg of vitamin K per 100 g contributes to normal blood clotting and the maintenance of normal bones.
- Its recorded folate content contributes to normal blood formation, cell division and homocysteine metabolism.
- About 0.21 mg of vitamin E per 100 g contributes to the protection of cells from oxidative stress.
- About 0.357 mg of vitamin B6 per 100 g contributes to normal protein and glycogen metabolism, nervous-system function and red blood-cell formation.
- About 127 mg of calcium per 100 g contributes to the maintenance of normal bones and teeth, muscle function and nerve transmission.
- About 1,332 mg of potassium per 100 g contributes to normal muscle and nervous-system function and the maintenance of normal blood pressure.
- About 156 mg of magnesium per 100 g contributes to normal energy metabolism and muscle and nervous-system function.
- About 5 mg of iron per 100 g contributes to normal red-blood-cell and haemoglobin formation and oxygen transport. Absorption of plant iron varies with the meal.
- No single food prevents or treats disease. The nutritional value of cranberry beans depends on portion size, variety, ripeness and the overall eating pattern.
Cranberry Beans nutrition facts
The table covers calories, macronutrients, vitamins, minerals, fatty acids and amino acids where a measured value is available. Values are shown per 100 g and for a 100 g reference serving.
| Nutrient | Per 100 g | 100 g serving |
|---|---|---|
| Core values and macronutrients | ||
| Energy | 335 kcal | 335 kcal |
| Water | 12.6 g | 12.6 g |
| Protein | 23 g | 23 g |
| Total fat | 1.2 g | 1.2 g |
| Saturated fat | 0.244 g | 0.244 g |
| Monounsaturated fat | 0.101 g | 0.101 g |
| Polyunsaturated fat | 0.501 g | 0.501 g |
| Carbohydrate | 60.1 g | 60.1 g |
| Dietary fiber | 24.7 g | 24.7 g |
| Total sugars | 2.2 g | 2.2 g |
| Ash | 3.1 g | 3.1 g |
| Cholesterol | 0 mg | 0 mg |
| Minerals | ||
| Calcium | 127 mg | 127 mg |
| Iron | 5 mg | 5 mg |
| Magnesium | 156 mg | 156 mg |
| Phosphorus | 372 mg | 372 mg |
| Potassium | 1,332 mg | 1,332 mg |
| Sodium | 6 mg | 6 mg |
| Zinc | 3.6 mg | 3.6 mg |
| Copper | 0.841 mg | 0.841 mg |
| Manganese | 1.1 mg | 1.1 mg |
| Selenium | 12.8 µg | 12.8 µg |
| Vitamins and vitamin-like compounds | ||
| Vitamin C | 0 mg | 0 mg |
| Vitamin B1 (Thiamin) | 0.747 mg | 0.747 mg |
| Vitamin B2 (Riboflavin) | 0.213 mg | 0.213 mg |
| Vitamin B3 (Niacin) | 1.2 mg | 1.2 mg |
| Vitamin B5 (Pantothenic acid) | 0.731 mg | 0.731 mg |
| Vitamin B6 | 0.357 mg | 0.357 mg |
| Vitamin B9 (Folate) | 604 µg | 604 µg |
| Food folate | 604 µg | 604 µg |
| Folate, DFE | 604 µg DFE | 604 µg DFE |
| Choline | 66.4 mg | 66.4 mg |
| Vitamin B12 | 0 µg | 0 µg |
| Vitamin A | 0 µg RAE | 0 µg RAE |
| Vitamin E | 0.21 mg | 0.21 mg |
| Vitamin D | 0 µg | 0 µg |
| Vitamin K | 5.6 µg | 5.6 µg |
| Fatty acids | ||
| Omega-3 | 0.278 g | 0.278 g |
| Omega-6 | 0.223 g | 0.223 g |
| Fatty-acid details | ||
| Trans fat | 0 g | 0 g |
| Alpha-linolenic acid (ALA) | 0.278 g | 0.278 g |
| Linoleic acid | 0.223 g | 0.223 g |
| EPA | 0 g | 0 g |
| DHA | 0 g | 0 g |
How many calories are in Cranberry Beans?
100 g (about 3.5 oz) provides approximately 335 kcal. A 100 g reference serving provides approximately 335 kcal. Values vary with variety, ripeness and preparation.
How to use Cranberry Beans in the kitchen
Cranberry Beans can be used raw when food-safe or prepared by steaming, roasting, sautéing, simmering or adding to soups and salads, depending on the ingredient.
Related vegetables
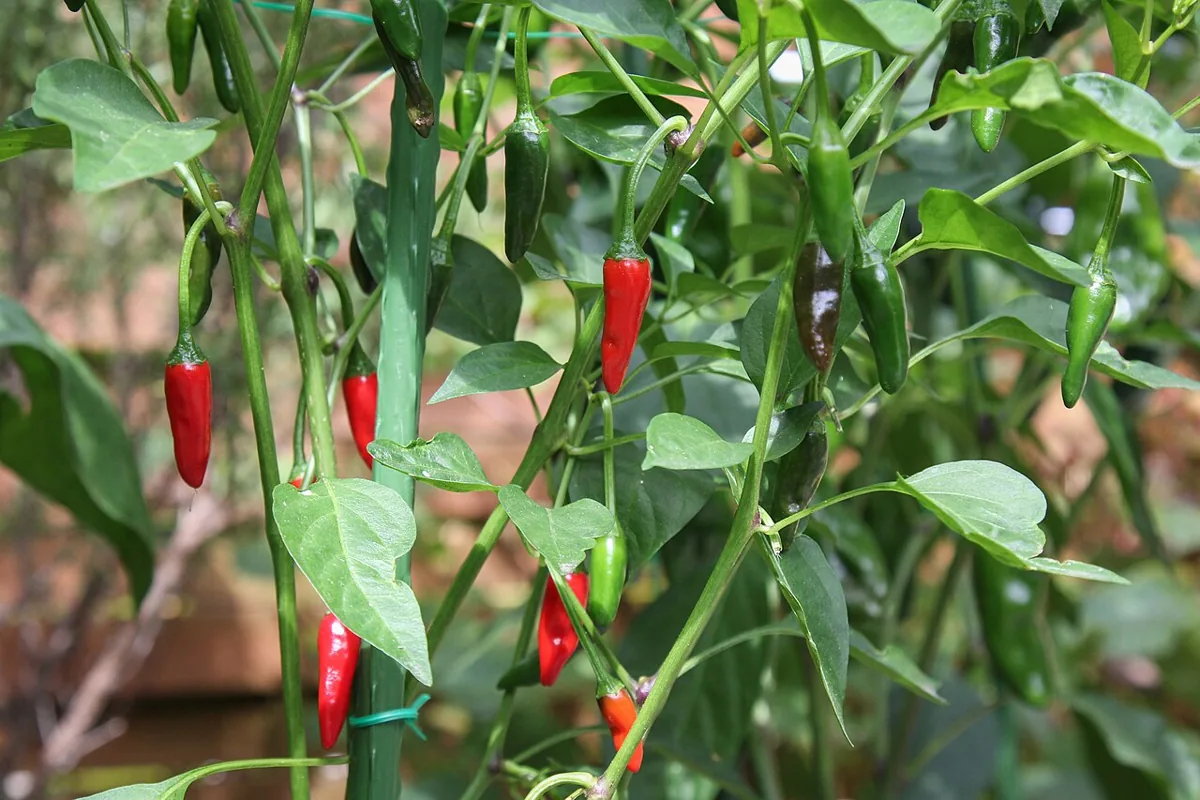
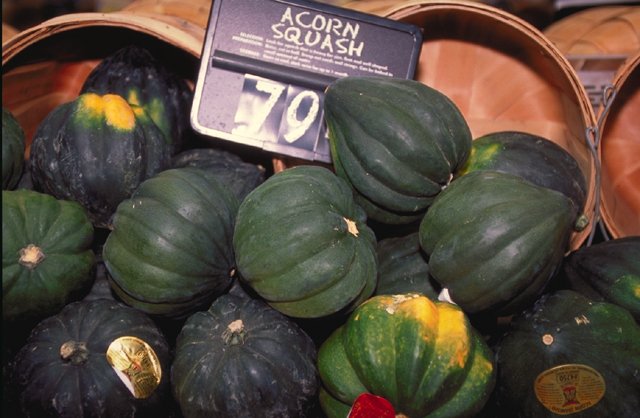
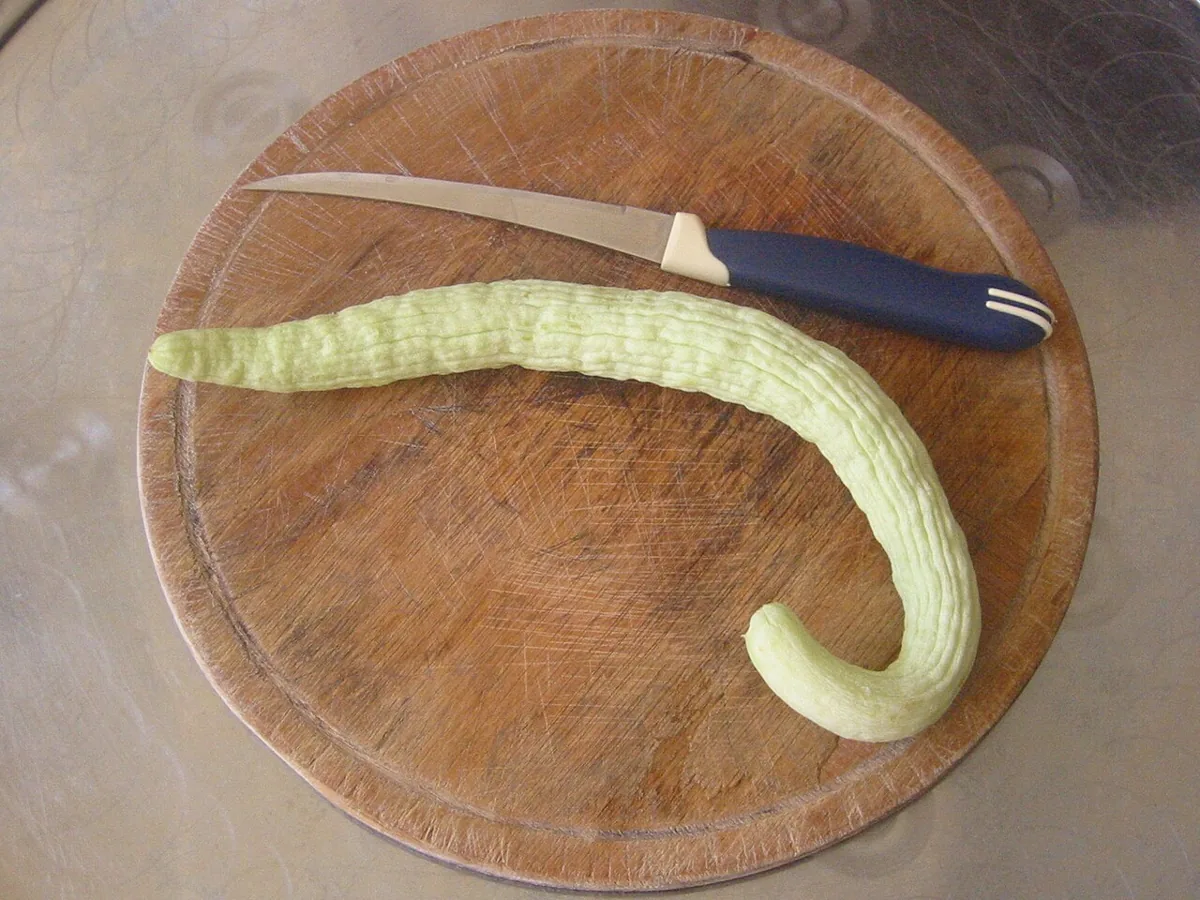
Direct USDA records are used where available; closest-profile entries are explicitly labelled and remain approximate. Blank fields mean that the source did not report a value. General information only; not medical advice. Primary composition reference: USDA FoodData Central.